

Your print shop just landed three big orders this morning. Good news, right? Maybe. Without knowing your actual press capacity, current job margins, and whether your bindery can handle the volume, you're basically gambling with your business.
Most print shops track revenue and basic job counts. That's like driving a car by only watching the speedometer while ignoring the fuel gauge, engine temperature, and that weird knocking sound. You need deeper operational visibility to make profitable decisions about when to hire, when to invest in equipment, and which jobs to prioritize.
The capacity trap that kills print shop profitability
A print shop owner sees their calendar filling up with jobs. Revenue looks good on paper. They assume they're doing well. Then overtime costs spike, deadlines slip, quality issues emerge from rushed work, and suddenly that healthy-looking revenue gets eaten by operational chaos.
The problem compounds when shops try to solve capacity issues by feel. They hire when things feel overwhelming. They buy equipment when delays become embarrassing. They adjust pricing when cash gets tight. Each reactive decision creates new problems downstream.
A commercial printer was consistently booking $180k monthly but barely breaking even. Their four-color press ran 14 hours daily, bindery worked weekends, and they still missed deadlines. When we mapped their actual capacity against demand, we discovered their press was only achieving 52% efficiency during those long days. Jobs sat waiting for plates. Makereadies took forever because nobody tracked setup patterns. The bindery bottleneck meant completed press runs piled up for days. Without clear operational metrics, they kept accepting rush jobs that disrupted everything, thinking the premium pricing justified the chaos. It didn't.
Why standard manufacturing OEE doesn't work for print shops
Traditional Overall Equipment Effectiveness tracks availability, performance, and quality for manufacturing. Print shops need something different because your operational reality involves constant job changes, varying substrates, different finishing requirements, and customer-driven timelines.
Eliminate order confusion and delays.
GoInkly helps you manage every print order efficiently from submission to delivery.
- Centralized order tracking
- Production workflow management
- Inventory and supply monitoring
No credit card required
A press-adapted OEE needs to account for:
-
Setup complexity variations - A business card job switching to a perfect-bound catalog isn't the same as swapping similar jobs. Your metrics need to reflect actual changeover impact, not just downtime minutes.
-
Substrate and specification changes - Running coated stock after newsprint requires different considerations than manufacturing widgets. Your efficiency calculations should factor in these operational requirements.
-
Multi-stage production reality - Most print jobs touch multiple departments. Measuring press efficiency alone misses the complete picture when jobs bottleneck at cutting, folding, or binding.
-
Customer-imposed constraints - Unlike manufacturing, you can't always optimize job sequencing. Client deadlines and approval processes create forced inefficiencies your metrics need to acknowledge.
A press-adapted OEE needs to account for:
The three KPIs that actually predict print shop health
Three metrics consistently separate thriving operations from struggling ones:
Press-Adapted OEE with Context
-
Productive run time (actual printing)
-
Setup and makeready time by job type
-
Maintenance and cleaning time
-
Waiting time (for materials, approvals, or upstream processes)
A healthy print shop typically sees 65-75% press OEE when properly measured. Below 60% means systematic problems. Above 80% often means you're cherry-picking easy jobs and leaving money on the table.
Break down press OEE by shift and job family to spot hidden inefficiencies.
Gross Margin per Job Category
Revenue tells you nothing about profitability. Track actual margins by:
-
Job type (business cards vs. catalogs vs. wide-format)
-
Customer segment (walk-ins vs. contracts vs. agencies)
-
Run length categories
-
Turnaround time requirements
This reveals which work actually makes money versus which just keeps machines running. One shop discovered their "bread and butter" small-run jobs averaged 18% margins while their "difficult" long-run catalogs hit 34% margins. They'd been prioritizing exactly wrong.
Lead Time Performance by SKU
Don't average all lead times together. Track separately:
-
Standard products (business cards, flyers, postcards)
-
Custom jobs (unique sizes, special finishes)
-
Repeat orders vs. new jobs
-
Rush vs. standard turnaround
When lead times stretch in specific categories, you know exactly where capacity issues hide before they explode into customer complaints.
Building your capacity planning model (without an MBA)
Forget complex formulas. Build a practical capacity model by answering four questions:
-
1. What's your actual daily capacity? Start with press hours, but subtract: - Average daily setup time based on job mix - Planned maintenance windows - Typical waiting and material handling time If your press runs 10 hours daily with 2.5 hours average setup across 4 jobs, plus 30 minutes maintenance, your actual capacity is 7 hours of production time.
-
2. What's your job mix reality? Map your typical week
- How many job types - Average run lengths - Setup requirements for each - Downstream processing needs This becomes your baseline demand profile.
-
3. Where do jobs actually bottleneck? Track where completed work piles up: - Between press and cutting - Waiting for bindery - At packaging/shipping - During proof approval cycles Your true capacity is your bottleneck capacity, not your press capacity.
-
4. What's your surge capability? Calculate how much extra you can handle through: - Overtime (at what cost?) - Outsourcing specific processes - Weekend runs - Pushing non-urgent jobs This tells you when you're approaching hard limits versus just feeling busy.
Here's a simple visual of the capacity planning workflow.
| Question | Details |
|---|---|
| 1. What's your actual daily capacity? | Start with press hours, but subtract: - Average daily setup time based on job mix - Planned maintenance windows - Typical waiting and material handling time |
| 2. What's your job mix reality? | Map your typical week: - How many job types - Average run lengths - Setup requirements for each - Downstream processing needs |
| 3. Where do jobs actually bottleneck? | Track where completed work piles up: - Between press and cutting - Waiting for bindery - At packaging/shipping - During proof approval cycles |
| 4. What's your surge capability? | Calculate how much extra you can handle through: - Overtime (at what cost?) - Outsourcing specific processes - Weekend runs - Pushing non-urgent jobs |
The visual highlights the sequence: measure capacity, map demand, identify bottlenecks, and plan surge responses.
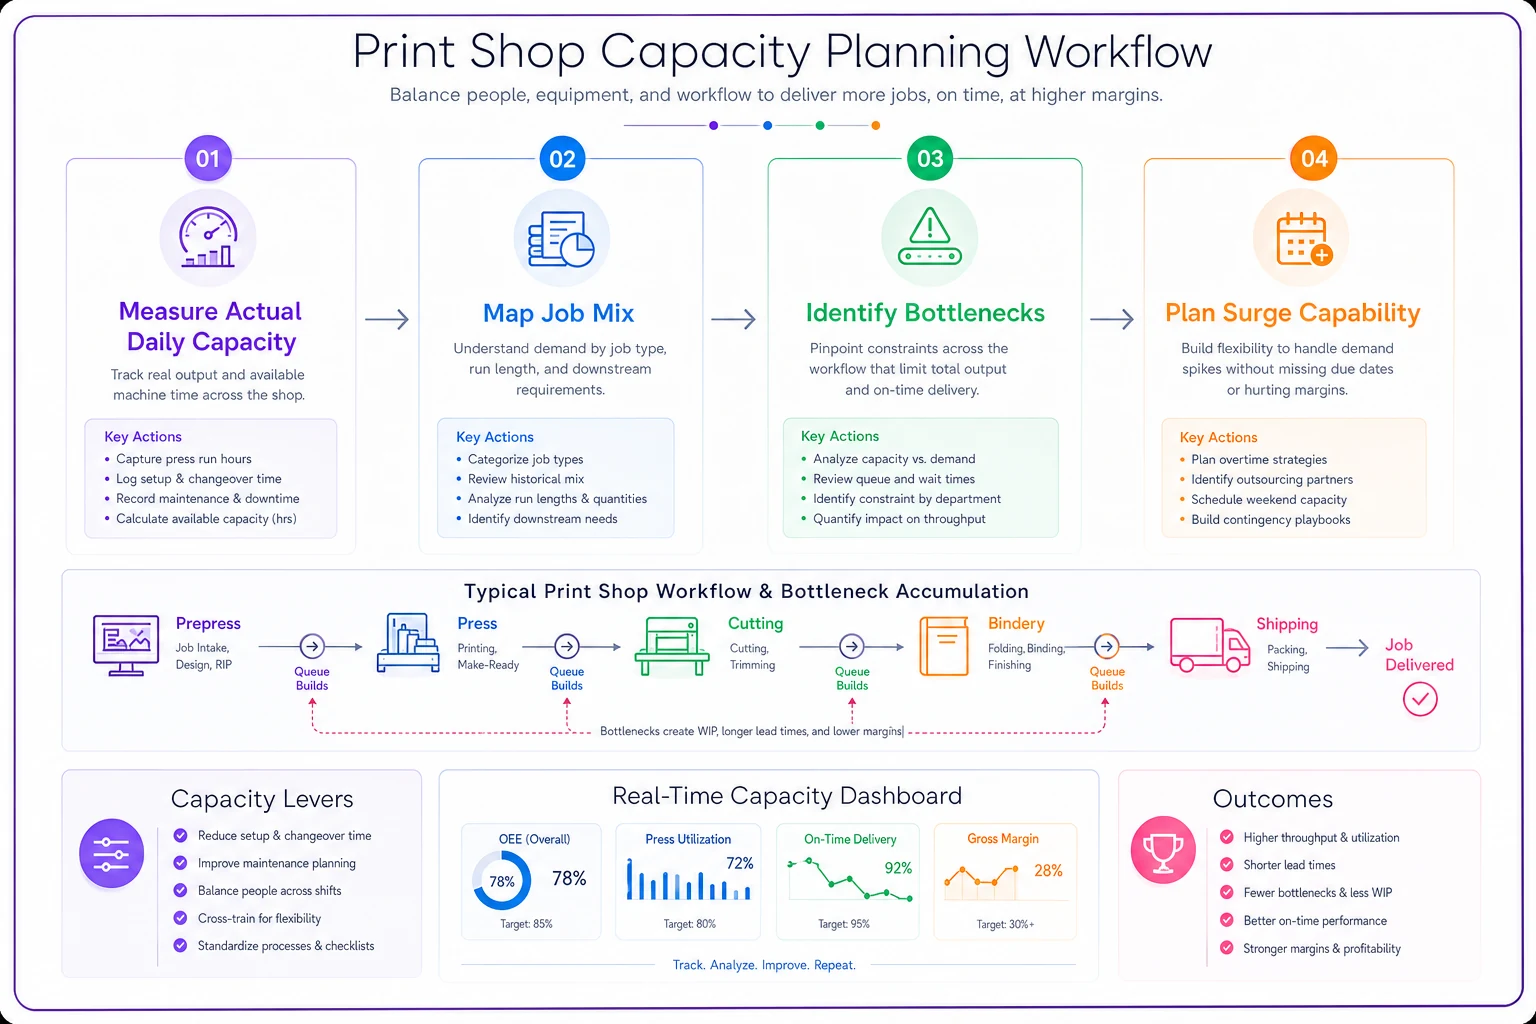
Use this workflow as a daily check: capacity -> demand -> bottleneck -> surge.
Decision triggers that remove guesswork from hiring and equipment investments
Stop making gut-feel decisions about expansion. Set clear triggers based on your actual metrics:
When to hire another press operator:
-
Press OEE consistently above 75% for 6 weeks
-
Overtime exceeds 15% of regular hours for a month
-
Job lead times extending beyond quoted dates
-
Gross margins still healthy (not just busy)
When to add bindery capacity:
-
Work-in-process inventory exceeds 2 days of bindery capacity
-
Bindery overtime exceeds press overtime
-
Jobs regularly ship late due to finishing bottlenecks
-
Cost of outsourcing bindery exceeds 25% of equipment payment
When to invest in automation:
-
Setup time exceeds 25% of total press time
-
Repeat job percentage above 40%
-
Manual touchpoints causing consistent errors
-
Labor costs exceeding 35% of job value
When to raise prices (not add capacity):
-
Consistently above 85% capacity
-
Turning away work weekly
-
Rush job percentage exceeding 30%
-
Margins compressed below target despite full utilization
When to raise prices (not add capacity):
The dashboard view that changes everything
Instead of drowning in spreadsheets, build a single-screen view showing:
-
Daily Capacity Status - Current press OEE (last 7 days) - Today's scheduled vs. actual capacity - Tomorrow's committed capacity - End-of-week projection
-
Margin Health - Week-to-date gross margin - Margin by job category (visual comparison) - Problem jobs flagged (below threshold)
-
Flow Indicators - Current WIP by department - Jobs at risk (behind schedule) - Bottleneck indicators (where work accumulates)
-
Decision Triggers - Visual indicators when metrics hit action thresholds - Trend arrows showing direction - Alerts for investigation needed
One print shop implemented this dashboard approach and discovered they were losing $1,100 weekly on small-format digital jobs while their wide-format work generated 42% margins. They shifted capacity allocation, raised digital minimums, and improved monthly profit by $6,800 without adding equipment or staff.
How AI-powered operations software transforms print shop management
Modern print shops need more than spreadsheets to track these metrics effectively. AI-powered operational software can automatically capture production data, calculate real-time OEE, track job profitability, and identify bottlenecks before they impact delivery.
These platforms connect your estimating, production scheduling, and job tracking into a unified view. Instead of manually calculating metrics weekly, you see live capacity utilization, margin trends, and upcoming bottlenecks continuously. The AI components help identify patterns humans miss - like specific job combinations that consistently cause delays or customer types that generate hidden costs.
The operational impact extends beyond reporting. When your scheduling system understands actual capacity constraints and margin targets, it can optimize job sequencing automatically. It flags when accepting a rush job would cascade into delays. It identifies which repeat jobs could be batched for efficiency. This transforms capacity planning from reactive firefighting to proactive optimization.
Common capacity planning mistakes that tank profitability
Measuring busyness instead of productivity A shop running two shifts might feel maxed out while operating at 45% actual efficiency. Long hours don't equal productivity. Track value-generating time, not clock time.
Ignoring the compound effect of rush jobs One rush job doesn't just disrupt today's schedule. It cascades through your entire workflow, impacting setups, creating additional changeovers, and forcing other jobs to wait. Track the true cost ripple effect.
Capacity planning without margin context Running at 90% capacity sounds great until you realize you're fully booked with low-margin work. Better to run at 70% capacity with profitable jobs than 100% with commodity printing.
Forgetting about knowledge capacity Your senior operator who handles complex jobs represents critical capacity. When they're sick or on vacation, your effective capacity drops more than just losing a body. Plan for expertise bottlenecks, not just equipment constraints.
The path from firefighting to strategic growth
Print shops that implement comprehensive KPI tracking and capacity planning consistently see similar improvements within 90 days:
-
Overtime costs drop 20-35% while maintaining output
-
On-time delivery improves to 95%+ from typical 75-80%
-
Gross margins increase 4-8 points through better job selection
-
Equipment investment decisions become data-driven, not panic-driven
More importantly, owners stop living in constant crisis mode. When you know your actual capacity, current utilization, and profitability by job type, every decision becomes clearer. You quote realistic deadlines. You price according to actual costs. You invest in equipment before bottlenecks become critical.
The difference between thriving print shops and struggling ones isn't usually equipment or location or even customer base. It's operational visibility. When you truly understand your capacity and margins, you make profitable decisions consistently instead of hoping things work out.
Your competitors are still flying blind, making gut-feel decisions about pricing, capacity, and investments. Build your KPI dashboard and capacity model now, while they're still guessing. The operational advantage compounds quickly in this business where margins are thin and efficiency determines survival.
Your competitors are still flying blind, making gut-feel decisions about pricing, capacity, and investments. Build your KPI dashboard and capacity model now, while they're still guessing. The operational advantage compounds quickly in this business where margins are thin and efficiency determines survival.
Ready to simplify your print shop operations?
Join 500+ print shops using GoInkly to save time, reduce errors, and improve customer satisfaction.