

Most print shop owners think they have a pricing problem when really they have a decision architecture problem. You've probably calculated your hourly press rates, know your material costs, maybe even built out job costing sheets. But when a customer asks for 5,000 tri-fold brochures with UV coating by Thursday, you still hesitate. Quote too high and lose the job. Quote too low and work yourself into the ground for nothing.
Why traditional pricing models break in modern print shops
Print shops operate differently than they did even five years ago. You're juggling digital short runs, offset long runs, wide-format one-offs, finishing services, and rush orders—all while managing fluctuating paper costs and client expectations shaped by online print giants.
The old cost-plus markup approach assumes every job flows through your shop the same way. But a 500-piece business card order hits your operation completely differently than a 10,000-piece catalog run. One ties up your digital press for 20 minutes. The other monopolizes your offset press for half a day, plus bindery time.
When you treat all jobs the same, profitable work ends up subsidizing money-losing work. You take everything that comes through the door because you can't quickly identify which jobs actually make money after accounting for setup time, machine capacity, and opportunity cost.
The shops that thrive have moved beyond simple markup pricing to what I'd call profitability architecture—a decision framework that maps your actual capacity constraints and true job costs into clear price bands and operational triggers.
Building your capacity foundation
Before you can architect profitable pricing, you need brutal clarity on your actual production capacity. Not theoretical capacity—real capacity after accounting for makereadies, maintenance, reprints, and all the friction that eats into productive hours.
Eliminate order confusion and delays.
GoInkly helps you manage every print order efficiently from submission to delivery.
- Centralized order tracking
- Production workflow management
- Inventory and supply monitoring
No credit card required
Start by mapping your constraint resources. For most shops, this breaks into three categories.
Primary production constraints: These are your actual moneymakers—offset presses, digital presses, wide-format printers. Track not just rated speeds but effective throughput after accounting for job changes. A Heidelberg Speedmaster might run 15,000 sheets per hour, but if you're averaging 12 job changeovers per day at 20 minutes each, you've lost 4 hours of production time right there.
Secondary processing constraints: Your bindery equipment, laminators, die-cutters, folders. These often become surprise bottlenecks. That folder might process 6,000 pieces per hour, but if it needs 45-minute makereadies between different fold patterns, it becomes your limiting factor on multi-job days.
Human capacity constraints: Pre-press hours, finishing labor, quality control time. A single prepress operator handling 15–20 jobs per day becomes a massive bottleneck during busy periods, no matter how fast your presses run.
Track changeover and makeready times separately for each press for at least two weeks to capture realistic capacity losses.
Map these constraints into time blocks. If your main digital press has 8 productive hours per day after maintenance and changeovers, that's 40 hours per week of revenue-generating capacity. Every job you take consumes some portion of that finite resource.
Calculating true job cost beyond materials
Most shops mess up here—they calculate material cost, add labor, tack on overhead, and call it done. But true job costing for mixed-batch operations requires understanding opportunity cost and capacity consumption.
Take a real example. Say you're evaluating a rush order for 2,500 postcards:
-
Paper
$85
-
Ink/toner
$45
-
Direct labor (30 minutes press, 20 minutes finishing)
$42
Direct costs total $172. Traditional pricing might mark this up 100% to $344. Seems profitable, right?
But during those 45 minutes of press time, you could have run three standard business card orders at $180 each—$540 in alternative revenue. Suddenly that "profitable" rush job looks a lot different.
This is why you need to calculate the capacity cost per minute for each piece of equipment. Take your monthly fixed costs—lease payments, maintenance contracts, allocated overhead—and divide by actual productive minutes per month. That offset press costing $8,500 per month in lease and maintenance? At 6 productive hours per day, 22 days per month, that's roughly $10.73 per minute of capacity.
Now the true job cost looks like this:
-
Direct materials and labor
$172
-
Capacity cost (45 min × $10.73)
$483
-
True job cost
$655
That changes everything about how you price.
Creating dynamic price bands based on capacity state
Static price lists kill profitability. The same job might be worth $400 when you're slow and $900 when you're slammed. Your pricing should flex based on current capacity utilization.
Build your pricing architecture around four capacity states:
Here's a simple workflow to decide which price band applies based on current capacity.
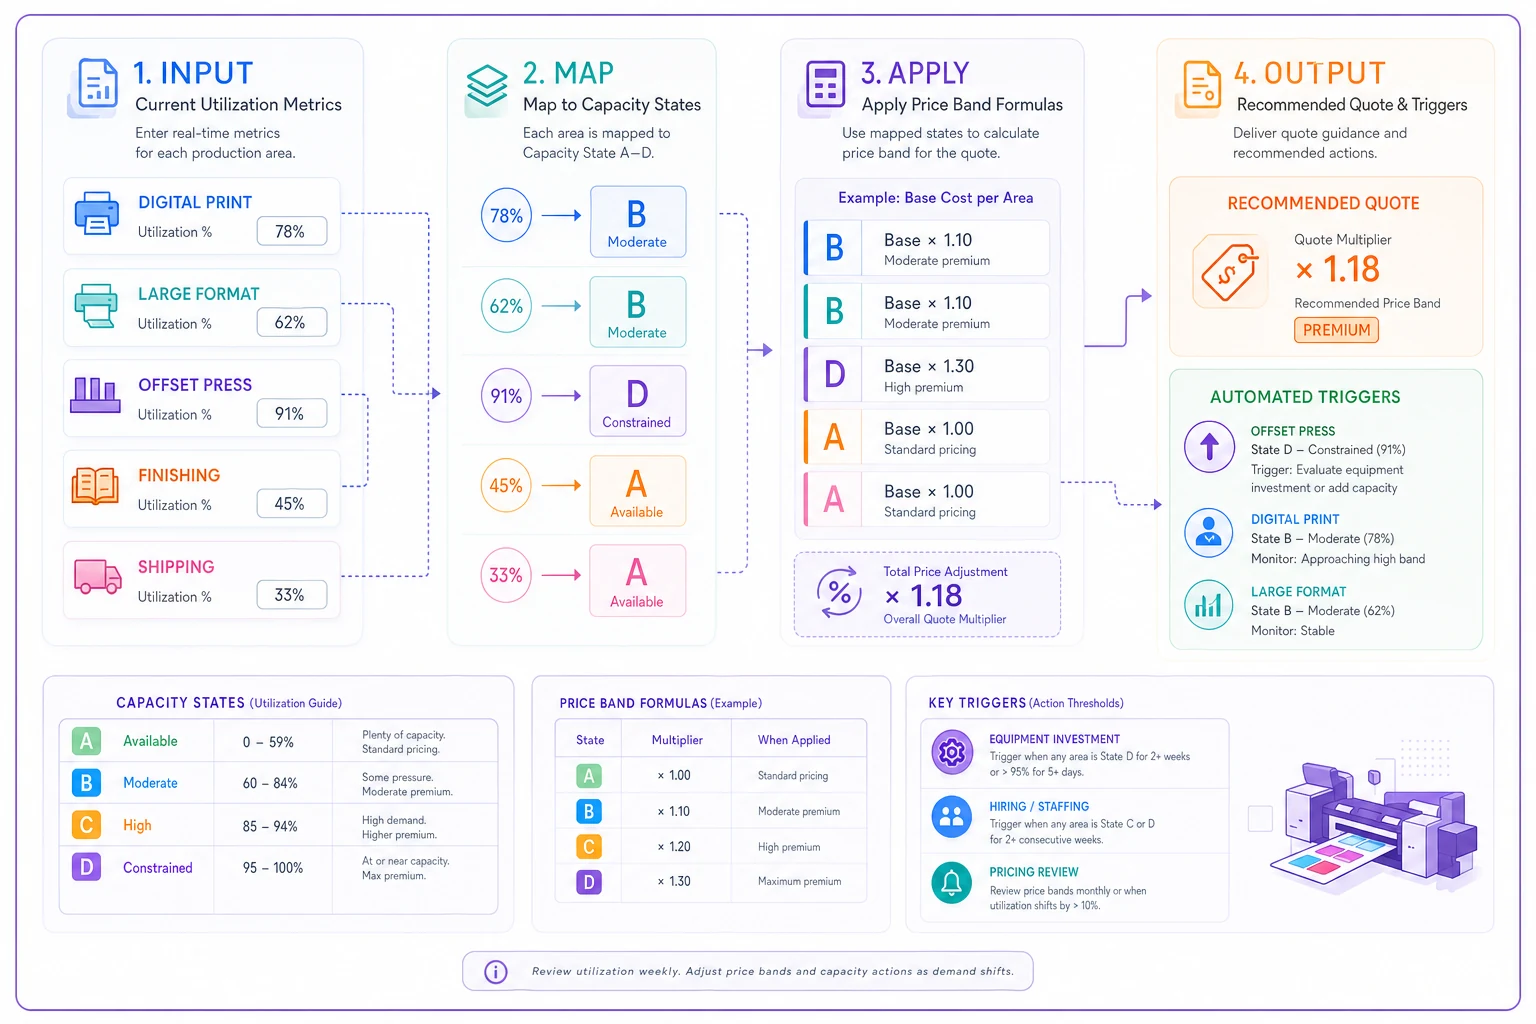
Capacity State A: Under 60% utilized Survival mode. You need volume to cover fixed costs. Set prices at true job cost plus 15–25% margin. Take almost anything that covers variable costs and contributes to overhead—this is when you run those school newsletter jobs and nonprofit flyers. Price band formula: (Direct costs + 50% capacity cost) × 1.15
Capacity State B: 60–80% utilized Steady workflow but room for more. Target 35–45% margins. Be selective about rush work and complex jobs that create downstream bottlenecks. Price band formula: (Direct costs + 75% capacity cost) × 1.35
Capacity State C: 80–95% utilized Running near capacity. Only take high-margin work or strategic accounts. Price rush jobs aggressively—double or triple standard rates. If someone needs 10,000 flyers by tomorrow and you're this busy, they should pay for the disruption. Price band formula: (Direct costs + 100% capacity cost) × 1.65
Capacity State D: Over 95% utilized Maxed out. Only take work at premium prices that justify overtime, outsourcing, or turning away other jobs. This is where 200–300% markups make sense. Price band formula: (Direct costs + 150% capacity cost) × 2.0
The key is making these states visible to your sales team in real time. Build a simple dashboard showing current capacity state for each production area. When sales knows you're in State C for digital but State A for offset, they can price accordingly.
Investment and hiring triggers from profitability data
Your profitability architecture should tell you exactly when to invest in equipment or staff. Stop making these decisions based on gut feel or when you're already drowning.
Equipment investment triggers:
When any production area stays above 85% capacity for around six consecutive weeks, start evaluating equipment additions. But calculate the revenue threshold needed to justify the investment first.
Say you're considering a second digital press at $3,500/month lease. You need to generate at least $8,750 in additional monthly gross profit to justify it (assuming 40% target margin). That means roughly $22,000 in new monthly revenue. Can you consistently fill that capacity? If yes, pull the trigger. If not, look at overtime or outsourcing partnerships first.
Hiring triggers:
Track profitability by capacity state. When State C and D jobs represent over 40% of your revenue for three consecutive months, you have the pricing power to support additional staff costs.
The math: if you're turning away $30,000/month in work due to capacity constraints, hiring a $4,500/month operator who can capture even half that volume adds around $6,000/month to your bottom line at 40% margins.
Don't hire when you feel busy. Hire when the numbers prove you're leaving money on the table.
Worked example: implementing price bands in practice
Here's how this plays out with a mid-size shop doing around $2.8M annually.
The shop profile:
-
1 offset press (Komori 4-color)
-
2 digital presses (Xerox Versant)
-
Standard finishing equipment
-
8 production staff
-
Around 310 jobs per month
Step 1: Calculate capacity baselines
-
Offset press
32 productive hours/week
-
Digital press 1
38 productive hours/week
-
Digital press 2
36 productive hours/week
-
Bindery
45 productive hours/week
Step 2: Determine capacity costs
-
Offset press
$12,000 (lease, maintenance, overhead allocation)
-
Digital presses
$7,500 each
-
Bindery
$4,000
-
Total
$31,000
Capacity cost per hour:
-
Offset
$93.75/hour
-
Digital
$49.34/hour
-
Bindery
$22.22/hour
Step 3: Build price bands
| Capacity State | Direct Costs | Capacity Charge | Total Price | Margin |
|---|---|---|---|---|
| State A (<60%) | $385 | $125 | $587 | 15% |
| State B (60–80%) | $385 | $187 | $772 | 35% |
| State C (80–95%) | $385 | $250 | $1,048 | 65% |
| State D (>95%) | $385 | $375 | $1,520 | 100% |
Step 4: Implement triggers
-
When offset hits State C for 2 weeks
Stop accepting offset jobs under $2,000
-
When digital hits State C for 3 weeks
Evaluate adding a third digital press
-
When bindery hits State D
Mandatory overtime approval or outsource finishing
Results after 6 months:
-
Average job margin increased from 31% to 43%
-
Turned away 18% fewer jobs through better capacity matching
-
Revenue increased 12% with the same equipment
-
Identified optimal time to add a third digital press (month 4)
-
Unprofitable rush jobs dropped by around 60%
The difference was simple—they stopped guessing and started making decisions based on actual capacity states and profitability triggers.
Common pitfalls in profitability architecture
Even with a solid framework, shops stumble on implementation. A few traps worth knowing about.
Ignoring seasonal capacity variations
Your capacity isn't static. December's holiday card rush creates different constraints than July's slow period. Build seasonal adjustment factors into your pricing bands. That same postcard job might be State B pricing in August and State D pricing in November.
Forgetting opportunity cost in custom work
Complex custom jobs don't just consume production time—they consume problem-solving time, create quality risks, and often require multiple reprints. A "simple" die-cut job that needs three hours of prepress experimentation has massive hidden capacity costs that never show up in your estimate.
Not accounting for setup clustering
Running similar jobs back-to-back dramatically reduces capacity consumption. Five business card orders might take 3 hours if run separately but only 90 minutes if ganged. Your pricing architecture should incentivize customers to standardize specifications or accept longer turnarounds in exchange for better prices.
Treating all capacity as equal
Tuesday afternoon capacity isn't worth the same as Monday morning capacity. Your best operators work day shift. Your newest hire works nights. Price accordingly—premium rates for jobs that have to run during prime capacity windows.
Technology's role in profitability decisions
Manual tracking of capacity states and price bands gets unmanageable as volume grows. You need systems that automatically calculate current capacity utilization and flag when your pricing assumptions need to shift.
This is where modern KPI tracking and capacity modeling becomes genuinely useful. AI-powered operational platforms can monitor real-time capacity across all production areas, adjust price quotes based on current state, and surface when you're approaching trigger points for hiring or equipment decisions.
The better systems integrate directly with your production schedule, updating capacity states as jobs move through the shop. When a CSR enters a quote request, the platform immediately reflects which capacity state applies and suggests pricing accordingly. No more gut-checking whether you have room for that rush job—the data tells you what to charge.
These platforms also track profitability patterns over time, which is where it gets interesting. You might discover that those "lucrative" real estate flyer jobs actually lose money once revision cycles and reprints get factored in. That's the kind of insight that's nearly impossible to surface manually when you're running 300+ jobs a month.
Making profitability architecture stick
Building the framework is one thing. Making it operational reality is another.
Start by making capacity states visible. Put a monitor in the sales area showing current capacity state for each production area. Color code it—green for State A, yellow for State B, orange for State C, red for State D. When everyone can see you're in the red on digital press capacity, higher quotes make sense to the whole team.
Train your sales team on the reasoning behind the pricing bands. They need to be able to explain to customers why the same job costs more during busy season. Something like: "We're currently at 90% capacity, so rush orders carry a premium to cover overtime and potential outsourcing costs." Most customers respect that kind of transparency over vague pricing.
Review your triggers monthly. Hitting equipment investment triggers but not acting on them? Either the triggers are too conservative or there are factors your model hasn't accounted for yet. Adjust accordingly.
Track margin by capacity state consistently. You should see a clear progression as utilization increases. If State C jobs aren't delivering 50%+ margins, the pricing bands need work.
And resist overriding the system for "good customers." Every exception erodes the framework. If certain customers genuinely deserve special pricing, build that in as a separate pricing tier—not as ad-hoc discounts that quietly wreck your capacity planning.
The compound effect of better decisions
Profitability architecture isn't about squeezing every penny from each job. It's about making consistently better decisions that compound over time.
When you price based on actual capacity state, you naturally balance workflow. Customers self-select into slower turnarounds when they see the price difference. Your shop runs smoother with fewer rush crises. When you have clear investment triggers, you add capacity at the right time—not so early it becomes a cash drain, not so late you've already lost customers to competitors.
When your team understands the connection between capacity utilization and pricing, operational decisions improve across the board. That press operator thinks twice before accepting a complex setup at 4 PM on a Friday. Your scheduler naturally groups similar jobs to maximize throughput.
Shops that implement this framework consistently see 10–15 point margin improvements within a year—not from blanket price increases, but from pricing intelligently based on actual operational constraints. Your profitability architecture becomes the decision-making backbone of the business, turning gut-feel choices into something you can actually plan around. Build the framework, trust the triggers, and the numbers tend to follow.
Profitability architecture isn't about squeezing every penny from each job. It's about making consistently better decisions that compound over time.
Ready to simplify your print shop operations?
Join 500+ print shops using GoInkly to save time, reduce errors, and improve customer satisfaction.